Thursday, January 28, 2016

MyRocks vs InnoDB with Linkbench over 7 days

After feedback from my previous post on Linkbench I repeated it for 7 days as the previous test ran for 1 day. The results are the same -- MyRocks sustains more QPS, is more IO efficient and provides better compression on IO-bound Linkbench. Ask your MySQL vendor when they will support MyRocks. The summary is:
  • InnoDB writes between 8X and 14X more data to SSD per transaction than RocksDB
  • RocksDB sustains about 1.5X more QPS
  • Compressed/uncompressed InnoDB uses 2X/3X more SSD space than RocksDB
I encourage others to use long running benchmark tests and present IO efficiency metrics in addition to performance results.


Configuration


I used the same configuration as described in the previous post with one difference. For this test I ran 168 iterations of the query step and each step ran for 1 hour. The test ran for 7 days while the previous test ran for 1 day. What I describe as QPS below is TPS (transactions/second) and when I use per query below I mean per transaction. The IO efficiency metrics are measured by iostat. I report the database size in GB at the end of each day - hours 1, 24, 48, 72, 96, 120, 144 and 168. For each one hour interval I collect:
  • average QPS
  • iostat reads per query (r/q)
  • iostat KB read per query(rKB/q)
  • iostat KB written per query (wKB/q)
  • iostat reads per second (r/s)
  • iostat KB read per second (rKB/s)
  • iostat KB written per second (wKB/s)
Tests were run for several binaries:
  • myrocks.zlib - Facebook MySQL 5.6, RocksDB with zlib compression
  • innodb56.none - upstream MySQL 5.6.26, InnoDB without compression
  • innodb57.none - upstream MySQL 5.7.10, InnoDB without compression
  • innodb56.zlib - upstream MySQL 5.6.26, InnoDB with zlib compression
  • innodb57.zlib - upstream MySQL 5.7.10, InnoDB with zlib compression

Better Compression


Compressed InnoDB uses about 2X more SSD space than MyRocks. Uncompressed InnoDB uses about 3.1X more SSD space than MyRocks. This graph shows the database size every 24 hours. Note that the database gets more data as a function of the QPS rate and MyRocks has more data than InnoDB after 168 hours -- myrocks.zlib has 6.4% more rows than inno57.none and 7.2% more rows than inno57.zlib after 7 days.

Better Performance


I'd be happy if MyRocks matched the QPS from InnoDB and only beat it on IO efficiency. But it wins on QPS and IO efficiency. The data below is QPS over time. MyRocks gets at least 1.5X more QPS than compressed InnoDB. It also does a lot better than uncompressed InnoDB but who wants to use 3X more SSD space. The QPS growth at test start for InnoDB with zlib happens because there are stalls until the compressed b-tree pages fragment. I think this is a problem with mutexes in the pessimistic insert/update code for compressed InnoDB.

The graph below shows the average QPS from each 1-hour interval.

Better IO Efficiency


I present IO efficiency metrics here using data from iostat normalized by the QPS rate to show the amount of IO done per transaction. 

This result is remarkable. InnoDB writes between 8X and 14X more to storage per transaction than MyRocks. This means that workloads can use TLC SSD with MyRocks when InnoDB requires MLC and that workloads can use SSD with MyRocks when SSD doesn't have sufficient endurance for InnoDB. Running a busy database on SSD is so much easier than using disk. 

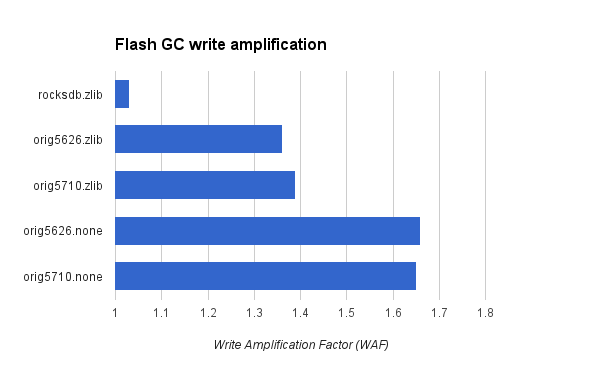
This result doesn't include the additional write-amplification from flash GC that occurs with InnoDB compared to MyRocks because the MyRocks write pattern generates less work for flash GC. I previously described how that increased the flash write-rate by about 1.5X for InnoDB compared to RocksDB for the device I use. This means that the real difference in write rates on SSD might mean that InnoDB writes 12X to 21X more to storage than MyRocks.

Using iostat metrics from hour 168 InnoDB writes 8.7, 10.5, 8.9 and 10.6 times more to storage per transaction compared to RocksDB. Using iostat data from hour 167 the difference is 11.5, 13.9, 11.7 and 14.0 times more data written.

The graph below shows the number of KB written to SSD per transaction from each 1-hour interval.

This graph shows the number of SSD reads per transaction. MyRocks has the smallest rate. While an LSM can have an IO penalty for range queries and range queries are the most frequent operation in Linkbench, that isn't a problem for this workload.
This graph shows the number of KB read from SSD per transaction. The rate for MyRocks is in between the rates for compressed and uncompressed InnoDB. The r/q rate is more important than this rate as long as the difference here isn't extreme. The rate for MyRocks includes reads done for user queries and reads done in the background for compaction.

Absolute iostat results


These graphs show absolute rates from iostat. The data is the average rate per 1-hour interval.

The first graph is the rate for iostat r/s. The rate is larger for MyRocks because it sustains the most QPS.

The next graph shows the rate for iostat wKB/s. Note that InnoDB sustains between 100 and 200 MB/s of writes. The SSD device is much busier doing writes for InnoDB than for MyRocks. IO capacity used for writes isn't available for reads even when endurance isn't an issue. More writes means more erases from flash GC and erases are a source of IO stalls when a read gets stuck behind the erase on the same channel.
The last graph shows the rate for iostat rKB/s. The rates are larger for uncompressed InnoDB and MyRocks compared to uncompressed InnoDB. The SSD is very busy if you combine the iostat rates for rKB/s and wKB/s.

How to build MongoRocks for MongoDB 3.2

This explains how I built MongoDB 3.2 from source with support for RocksDB thanks to help from Igor Canadi. There are more details here and here. My server uses Fedora.

# Install many of the dependencies for MongoRocks
sudo yum install snappy-devel zlib-devel bzip2-devel lz4-devel
sudo yum install scons gcc-g++ git

# Unpack MongoDB 3.2 source in $MONGOSRC

# Directory in which git repos are created
mkdir ~/git

# Get MongoRocks engine
cd ~/git
git clone https://github.com/mongodb-partners/mongo-rocks.git
cd mongo-rocks
git checkout --track origin/v3.2 -b v32


# get and build RocksDB libraries
git clone https://github.com/facebook/rocksdb.git
cd rocksdb
git checkout --track origin/4.4.fb -b 44fb
make static_lib

# prepare source build with support for RocksDB
cd $MONGOSRC
mkdir -p src/mongo/db/modules/
ln -sf ~/git/mongo-rocks src/mongo/db/modules/rocks

# build mongod & mongo binaries
# if you have zstd installed then use LIBS="lz4 zstd"
# if you need to debug and see command lines then add
#     --debug=presub

scons CPPPATH=/home/mdcallag/git/rocksdb/include \
      LIBPATH=/home/mdcallag/git/rocksdb \

      LIBS=lz4 mongod mongo

# install mongod
mkdir -p ~/b/m321
cd ~/b/m321
mkdir data
mkdir bin
cp $MONGOSRC/build/opt/mongo/mongod bin
cp $MONGOSRC/build/opt/mongo/mongo bin

# create mongo.conf file with the text that follows. You must
# change $HOME and consider changing 
the value for cacheSizeGB
---
processManagement:
  fork: true
systemLog:
  destination: file
  path: $HOME/b/m321/log
  logAppend: true
storage:
  syncPeriodSecs: 600
  dbPath: $HOME/b/m321/data
  journal:
    enabled: true
operationProfiling.slowOpThresholdMs: 2000
replication.oplogSizeMB: 4000
storage.rocksdb.cacheSizeGB: 40
---

# start mongod, consider using numactl --interleave=all
bin/mongod --config mongo.conf --master --storageEngine rocksdb

# confirm RocksDB is there
$ head -1 data/db/LOG

2016/01/28-11:54:15.738641 7f7bd45d5e80 RocksDB version: 4.4.0

Wednesday, January 20, 2016

MyRocks vs InnoDB, the insert benchmark and a disk array

This compares MyRocks and InnoDB using the insert benchmark. The test server has a disk array. The workload generates a lot of secondary index maintenance which can stress the server's random IO capacity.

tl;dr - the average insert rate is much better for MyRocks than for InnoDB

Configuration


The test server has 2 sockets, 8 cores (16 HW threads) per socket, 64GB of RAM and 14 disks with SW RAID 0 and a 2MB RAID stripe.

I tested MyRocks versus InnoDB from MySQL 5.6.26 and 5.7.10 from Oracle. Two configurations were tested for MyRocks. The first is the regular configuration described here. The second is the configuration optimized for load performance and called load-optimized. The load-optimized configuration sets rocksdb_bulk_load=1 to disable unique index checks and uses a smaller memtable to reduce the number of comparisons per insert.

The command line to run the insert benchmark for MyRocks is here. These are links to the my.cnf files for default MyRocks, load-optimized MyRocksMySQL 5.6 and MySQL 5.7. It is possible that I misconfigured background IO rates for InnoDB. MyRocks is much easier to configure. I have results for 6 configurations:
  • myrocks.def is MyRocks with the default configuration
  • myrocks.opt is MyRocks with the load-optimized configuration
  • mysql56.zlib is MySQL 5.6.26, InnoDB with zlib compression
  • mysql57.zlib is MySQL 5.7.10, InnoDB with zlib compression
  • mysql56.none is MySQL 5.6.26, InnoDB without compression
  • mysql57.none is MySQL 5.7.10, InnoDB without compression


Results


This is a summary of the load performance for people like me who prefer tables. The legend for the table below is:
  • #rows - number of rows inserted. The target is 1B but the test was stopped early for InnoDB because I wasn't willing to wait one week.
  • #secs - number of seconds for which the test ran.
  • avg_ips - average rate for rows inserted per second during the test. Note that the rate declines significantly over time for InnoDB.
  • last_ips - rows inserted per second for the last 100,000 inserts.

My summary of the table below is:
  • I didn't wait for the InnoDB tests to finish as that might have taken more 1 week.
  • There is a big difference between the insert rates for MyRocks and InnoDB.
  • There is a big difference between the insert rates for the default and load-optimized configurations of MyRocks. This difference is much smaller as the number of insert threads is increased.  The load-optimized configuration is 2.87X faster at 1 thread, 1.48X faster at 4 threads and 1.15X faster at 8 threads.
  • The insert rates for MyRocks increase with the number of insert threads. The results here are from a test with 1 thread. When I repeated a test with 8 threads the insert rate was ~50,000/second for MyRocks while the rates for InnoDB did not improve from those below.

#rows           #secs  avg_ips last_ips        engine
1000000000       96775  10333   10276          myrocks.def
1000000000       25009  39986   30339          myrocks.opt
 788300000      169511   4650    2834          mysql56.zlib
 470200000      164890   2852    1552          mysql57.zlib
 553700000      164989   3356    1925          mysql56.none
 524500000      168829   3107    1690          mysql57.none

Graphs


This is the insert rate over time for load-optimized MyRocks. There are a few stalls which I have yet to investigate. Otherwise the throughput is almost steady over time.

This is the insert rate for the default configuration of MyRocks. This has fewer stalls than the load-optimized configuration which is reasonable since there is less stress on compaction. Again the insert rate is almost steady over time.

This is the insert rate for all of the InnoDB configurations. The insert rate degrades significantly from the start of the test. I don't understand why MySQL56.zlib has the best throughput. InnoDB page flushing tuning is a complex art.


This is the insert rate over time for the InnoDB configurations using log scale for the y-axis. That makes it easier to see the difference as the rate declines.

Tuesday, January 19, 2016

The advantages of an LSM vs a B-Tree

The log structured merge tree (LSM) is an interesting algorithm. It was designed for disks yet has been shown to be effective on SSD. Not all algorithms grow better with age. A long time ago I met one of the LSM co-inventors, Patrick O'Neil, at the first job I had after graduate school. He was advising my team on bitmap indexes. He did early and interesting work on both topics. I went on to maintain bitmap index code in the Oracle RDBMS for a few years. Patrick O'Neil made my career more interesting.

Performance evaluations are hard. It took me a long time to get expertise in InnoDB, then I repeated that for RocksDB. Along the way I made many mistakes. Advice on doing benchmarks for RocksDB is here and here.

tl;dr - the MyRocks advantage is better compression and less write-amplification

The MyRocks Advantage


There are many benefits of the MyRocks LSM relative to a B-Tree. If you want to try MyRocks the source is on github, there is a wiki with notes on buildingmy.cnf and more details on the MyRocks advantage. Track down Yoshinori at the MyRocks tutorial at Percona Live or his talk at FOSDEM to learn more. The advantages include:
  • better compression - on real and synthetic workloads we measure 2X better compression with MyRocks compared to compressed InnoDB. A B-Tree wastes space when pages fragment. An LSM doesn't fragment. While an LSM can waste space from old versions of rows, with leveled compaction the overhead is ~10% of the database size compared to between 33% and 50% for a fragmented B-Tree and I have confirmed such fragmentation in production. MyRocks also uses less space for per-row metadata than InnoDB. Finally, InnoDB disk pages have a fixed size and more space is lost from rounding up the compressed page output (maybe 5KB) to the fixed page size (maybe 8KB).
  • no page reads for secondary index maintenance - MyRocks does not read the old version of a secondary index entry during insert, update or delete maintenance for a non-unique secondary index. So this is a write-only operation compared to read-page, modify-page, write-page for a B-Tree. This greatly reduces the random IO overhead for some workloads (benchmark results to be shared soon).
  • less IO capacity used for persisting changes - a B-Tree does more & smaller writes to persist a database while the MyRocks LSM does fewer & larger writes. Not only is less random IO capacity used, but the MyRocks LSM writes less data to storage per transaction compared to InnoDB as seen in the Linkbench results (look for wKB). In that case the difference was ~10X.
  • less write amplification from flash GC - the write pattern from the MyRocks LSM is friendlier to flash GC compared to InnoDB. This leads to lower write-amplification so that InnoDB was writing up to 18X more data per transaction compared to MyRocks as seen in the Linkbench results.
  • simpler code - RocksDB is much simpler than InnoDB. I have spent years with both -- debugging and reading code. MyRocks still has mutex contention, but the problem is easier to fix because the engine is simpler. New features are easier to add because the engine is simpler. We are moving fast to make MyRocks better.

The MyRocks Disadvantage


There is no free lunch with database algorithms. From theory we can expect better efficiency on writes and worse efficiency from reads with an LSM compared to a B-Tree. But what does that mean in practice? This will take time to figure out and I try to include IO efficiency metrics in my benchmark results that include disk reads, disk KB read and disk KB written per transaction to understand the differences. But at this point the IO efficiency improvements I see from MyRocks are much greater than the IO efficiency losses.

MyRocks is not as feature complete as InnoDB. While the team is moving fast the MySQL storage engine API is hard and getting harder. Missing features include text, geo, native partitioning, online DDL and XA recovery on the master (keep binlog & RocksDB in sync on master). I am not sure that text & geo will ever get implemented. I hope to see XA recovery and partial support for online DDL this year.

MyRocks is not proven like InnoDB. This takes time, a variety of workloads and robust QA. It is getting done but I am not aware of anybody running MyRocks in production today.

An LSM might use more CPU per query because more data structures can be checked to satisfy a query. This can increase the number of CPU cache misses and key comparisons done per query. It is likely to be a bigger deal on CPU-bound workloads and my focus has been on IO-bound. One example of the difference is the tuning that was required to make the MyRocks load performance match InnoDB when using fast storage. Although in that case the problem might be more of an implementation artifact than something fundamental to the LSM algorithm.

An LSM like MyRocks can also suffer from the range read penalty. An LSM might have to check many files to get data for a point or range query. Most LSMs, including MyRocks, use bloom filters to reduce the number of files to be checked during a point query. Bloom filters can eliminate all disk reads for queries of keys that don't exist. We have had some workloads on InnoDB for which 30% of the disk reads were for keys that don't exist.

Bloom filters can't be used on pure range queries. The most frequent query in Linkbench, and the real workload it models, is a short range query. Fortunately this query includes an equality predicate on the leading two columns of a covering secondary index (see the id1_type index in the Linkbench schema) and RocksDB has a feature to create the bloom filter on a prefix of the key (innovation!).

Even when the prefix bloom filter can't be used the range read penalty can be overstated. It is important to distinguish between logical and physical reads. A logical read means that data is read from a file. A physical read means that a logical read had to use the storage device to get the data. Otherwise a logical read is satisfied from cache. A range query with an LSM can require more logical reads than a B-Tree. But the important question is whether it requires more physical reads.

MyRocks vs InnoDB via Linkbench with a disk array

Previously I evaluated MyRocks and InnoDB for an IO-bound workload using a server with fast storage. Here I evaluate them for an IO-bound workload using a server with a disk array.

MyRocks sustains higher load and query rates than InnoDB on a disk array because it does less random IO on writes which saves more random IO for reads. This was the original motivation for the LSM algorithm. MyRocks does better on SSD because it writes less data to disk per commit. It compressed data 2X better than InnoDB which helps on both disk and SSD courtesy of improving the cache hit ratio. While the LSM algorithm was designed for disk arrays it also works great on SSD thanks to a better compression rate and better write efficiency. The LSM algorithm has aged well.

Configuration


This test used a server with two sockets, 8 cores (16 HW threads) per socket, 40GB of RAM and a disk array with 15 disks and SW RAID 0 using a 2MB RAID stripe.

Compared to the previous result, I used maxid1=200M in the Linkbench configuration to create a database about 1/5 the size of the previous test. These tests still used loaders=20 and requesters=20 to get 20 client threads for the load and query steps.

The pattern in which I ran the test changed. In the previous result I did the load and then ran 24 1-hour query steps with everything using 20 concurrent clients. In this test I have results for 1, 4, 8, 12, 16, 20, 24, 28 and 32 concurrent clients. For each level of concurrency data was loaded, 4 1-hour query steps were run and the result from the query step are shared from the 4th hour. Note that it takes about 24 hours on the SSD server for InnoDB QPS to stabilize as the index becomes fragmented. I did not run the query steps for 24 hours so the results here might understate InnoDB performance. The results also show the challenge of doing database benchmarks -- you have to get the engine into a steady state.

Compression


This shows the database size after load for uncompressed InnoDB (257 GB), compressed InnoDB (168 GB) and MyRocks (85 GB). Note that the server has 40G of RAM. MyRocks is able to cache a much larger fraction of the database than InnoDB but even for MyRocks at least half of the database is not in cache.

Load


In the previous result the load for uncompressed InnoDB was the fastest but that server had fast storage which hides the random IO penalty from InnoDB during page writeback. MyRocks has the fastest load in this case because the disk-array is much more limited on random IO and MyRocks does much less random IO on writes. One day I hope to explain why the load rate degrades for MyRocks beyond 8 threads. The data for the graph is here.

Query


MyRocks does much better on QPS as concurrency increases while InnoDB quickly saturates. MyRocks uses less random IO on writes which saves more random IO for reads. It also does better because it keeps a much larger fraction of the database in RAM. The data for the graph is here.

Efficiency


Alas, I don't have efficiency results because there was a bug in my test scripts.

Monday, January 18, 2016

Faster loads for MyRocks

In my previous post I evaluated Linkbench performance for MyRocks and InnoDB and the insert rate during the load was faster for InnoDB. Here I show that with tuning MyRocks can load as fast as InnoDB on SSD.

Tuning was required for SSD. On disk arrays loading is already much faster with MyRocks than InnoDB and I will publish those soon. The largest tuning benefit comes from setting the rocksdb_load_bulk session variable to disable checks for unique index constraints. A smaller tuning benefit comes from using a smaller value for write_buffer_size, 32MB rather than 128MB used in the previous test. The benefit from a smaller memtable is fewer compares per insert.

The number of load threads is configurable for Linkbench via the loaders variable and I have been using loaders=20. But that is only for the threads that load the link table. The node table in Linkbench is also large and always loaded by a single thread. I hope to make it multi-threaded but until then using too many threads for the link table makes the load slower for the node table. So I repeated the load with loaders=8.


Load Performance for MyRocks


The results below show the average load rate for many configurations. Tuned MyRocks is able to match or beat the load rate for InnoDB on SSD:

Best memtable size


What is the best memtable size? One approach is to minimize the total number of comparisons done while inserting into the memtable and when merging level 0 files during compaction into level 1. However the comparisons done during insert are in the foreground while comparisons done during compaction are in the background. It is possible that the background comparisons have no impact on latency as long as compaction can keep up with the insert rate. A small memtable reduces the number of compares done in the foreground which is why the best insert rate occurs for the smaller memtables.

Below I show the insert rate as a function of the memtable size. I used db_bench, the RocksDB benchmark client, and configured RocksDB to maximize the impact from memtable insert latency -- compaction disabled, WAL disabled, write batch of size 8, single-thread doing inserts. The insert rate declines as the memtable size is increased from 1MB to 128MB. The rate for a 2MB memtable is better than for 1MB because when the memtable is too small there are stalls while switching memtables. The data for the graph is here.


Friday, January 15, 2016

Even more write amplification when InnoDB meets flash GC

Yesterday I shared a benchmark report to compare MyRocks and InnoDB for Linkbench on a server with PCIe flash. One of the results was that InnoDB writes much more to storage per query, between 8X and 11X more. This is not a good thing because flash devices have a finite endurance and writing too much can lead to replacing the device too soon.

The results from yesterday used iostat to measure how much InnoDB writes to storage. The results from today use the counters on the storage device and the data from iostat. The total writes reported by the storage device will be larger than the value reported by iostat because flash GC runs in the background to make flash blocks ready for writing.  The ratio of device writes divided by iostat writes is the flash WAF (write amplification factor) and is >= 1.

On my storage device the flash WAF is much larger with InnoDB than with MyRocks. The flash WAF is about 1.4X for compressed InnoDB, 1.7X for uncompressed InnoDB and 1.03X for MyRock. This means that InnoDB writes between 11X and 18X more to storage per query compared to MyRocks. This is a huge difference which can force you to use high endurance flash for InnoDB when low endurance is sufficient for MyRocks. It can also force you to replace your storage device faster than desired. Note that excessive over-provisioning is similar to early replacement -- in both cases you buy more devices.

Configuration


All tests were run with the device about 72% full as flash WAF is also a function of device fullness. I started with the database from yesterday's result so the query step had run for 24 hours. I then added data to make each storage device about 72% full. Finally I ran 24 1-hour query steps and use the data from the 47th 1-hour query step reported in the table below.
  • Column 1 is the data written in GB per iostat  
  • Column 2 is the data written in GB per the storage device counters
  • Column 3 is the flash WAF (column 2 / column 1)
  • Column 4 is the relative write rate per iostat: column 1 divided by RocksDB column 1
  • Column 5 is the relative write rate per storage device counters: column 4 * column 3

                total GB written        relative KB written/query
                iostat  device  WAF     iostat  device
rocksdb.zlib    108.1   111.3   1.03    1.00    1.03
orig5626.zlib   492.6   670.0   1.36    8.51    11.57
orig5710.zlib   526.4   729.3   1.39    8.53    11.85
orig5626.none   723.2   1200.4  1.66    10.64   17.66
orig5710.none   640.9   1055.8  1.65    10.71   17.67

This chart displays the flash WAF per engine using the data from column 3 in the table above.
This chart has the per-query write rates as measured per iostat and per storage device counters. The rates are relative to the rates for RocksDB and you can see that InnoDB writes between 8X and 11X more per query when measured by iostat (blue bars) and between 11X and 18X more per query when measured at the storage device (red bars). Again, this is a huge difference.

Thursday, January 14, 2016

RocksDB vs InnoDB via Linkbench : performance and efficiency

MyRocks can reduce by half the hardware, or at least the storage hardware, required to run Linkbench compared to InnoDB. That is kind of a big deal.

A significant performance problem was recently fixed in MyRocks courtesy of the SingleDelete optimization. With this optimization RocksDB removes tombstones faster so that queries encounter fewer tombstones and waste less time on them. We hope to get the same feature into MongoRocks. I have been waiting a few months for this change and started another round of Linkbench tests when it arrived.

Performance and efficiency for MyRocks look great relative to InnoDB. We are far from done but I am amazed we reached this state so fast. The performance summary from my recent tests with IO-bound Linkbench and PCIe flash:
  • Uncompressed InnoDB loads faster than MyRocks and MyRocks loads faster than compressed InnoDB. I hope to figure out how to make MyRocks load faster than uncompressed InnoDB.
  • MyRocks uses about half the disk space compared to compressed InnoDB.
  • MyRocks writes much less to storage than InnoDB. This allows a workload to run on low-endurance SSD with MyRocks when it requires high-endurance SSD with InnoDB.
  • Average and p99 response times are much better for MyRocks
  • Maximum response times were usually better for InnoDB

Compression vs Device Endurance

Imagine a workload that uses 2 TB of storage and writes 100 MB/second to it. With 2X better compression it uses 1 TB of storage but might continue to write 100 MB/second. A side-effect of compression is that it increases the endurance required from a storage device and better endurance from SSD isn't free. Domas has been pointing out this side effect for many years.

This isn't a problem with MyRocks. It provides 2X better compression than compressed InnoDB for Linkbench. It also provides a write rate that is much less than half the InnoDB rate. When InnoDB uses 2 TB of storage and writes 100 MB/second to storage then MyRocks uses 1 TB of storage and writes less than 50 MB/second to storage. Alternatively we can put twice the number of databases on the server without increasing the storage or endurance requirements. For a server with 4 TB of storage we can either run 2 InnoDB databases that are 2 TB each and sustain 200 MB/second of writes or we can run 4 MyRocks databases that are 1 TB each and sustain less than 200 MB/second of writes. This assumes the server has sufficient CPU capacity.

Note that InnoDB writes more than 8X the number of bytes to storage per query compared to MyRocks. Many more details on that are below.


Configuration


I used my Linkbench repo to compare MyRocks with InnoDB in MySQL 5.6.26 and 5.7.10 with my.cnf files for MyRocks, 5.6.26 and 5.7.10. The test server has 2 sockets, 10 cores (20 HW threads) per socket, 144 GB of RAM and 3+ TB of PCIe flash. For Linkbench I configured loaders=20, requesters=20, maxid1=1B and maxtime=3600. The test pattern is first do the load and then run the query step 24 times for 1-hour each time. I collect performance data from MySQL, vmstat, iostat and the storage device during the tests. This is the schema for MyRocks, compressed InnoDB and uncompressed InnoDB.

I tested the following binaries:
  • rocksdb.zlib - MyRocks with zlib compression
  • orig5626.zlib - MySQL 5.6.26, InnoDB and zlib compression
  • orig5710.zlib - MySQL 5.7.10, InnoDB and zlib compression
  • orig5626.none - MySQL 5.6.26, InnoDB and no compression
  • orig5710.none - MySQL 5.7.10, InnoDB and no compression

Compression


This shows the database size at the end of each 1-hour query steps. The step function exists on the orig5710.none graph because the size is rounded to the nearest 100 GB once the size is >= 1 TB. Later in this post I show that MyRocks sustains a higher QPS during the query steps so it added the most data to the database. But the size growth is larger for InnoDB and likely caused by index fragmentation. This is the data for the graph. MyRocks uses less than half the space compared to compressed InnoDB.


Load


This displays the rate at which rows are inserted during the load with 20 concurrent clients. Uncompressed InnoDB has the best rate but I strongly prefer to use compression for this workload. Regardless I will debug this to see what can be done to help MyRocks have the best load rate on SSD. The data for the chart is here.

Query


This displays the average QPS from each 1-hour query step of Linkbench. The rate for compressed InnoDB increases significantly during the load because it suffers from contention as the b-tree becomes fragmented and page splits are done and this occurs more often immediately after the load. The data for the graph is hereThe QPS for MyRocks is much higher than for all of the InnoDB configurations.

Efficiency


MyRocks is more IO efficient than InnoDB for Linkbench. It has the lowest per-query rates for disk reads and disk bytes written. I think it does fewer disk reads because it keeps more data in cache. One reason is that InnoDB wastes space in the buffer pool for uncompressed pages courtesy of b-tree fragmentation. There are other reasons I won't describe here. There are several benefits from doing fewer disk reads. First, you can get more throughput when the storage device is close to saturation. Second, you use less CPU for decompression because every page must be decompressed after the read. Finally, you waste less time managing the buffer pool -- page eviction has been a source of performance problems for InnoDB. The data for the chart and graph is here.

Uncompressed InnoDB writes 10.4X more data to storage per query than MyRocks. Compressed InnoDB writes 8.4X more data to storage per query than MyRocks. MyRocks enables workload consolidation because it has much better compression and a lower write-rate than InnoDB. The MyRocks rate for bytes read from storage per query includes reads done in the background for LSM compaction. But I am not certain why that rate is between the rates for uncompressed and compressed InnoDB.

Quality of Service


Linkbench has 10 database transactions and reports response time metrics per transaction type. The transactions are ADD_NODE, UPDATE_NODE, DELETE_NODE, GET_NODE, ADD_LINK, UPDATE_LINK, DELETE_LINK, COUNT_LINK, MULTIGET_LINK and GET_LINKS_LIST. By far the most frequent transaction is GET_LINKS_LIST which requires a short range scan on a covering secondary index. The workload is explained in a blog post and conference paper. For the 24th 1-hour run the metrics are listed here per engine (MyRocks, InnoDB) and then reordered with results per transaction type for all engines. From the latter it is clear that while maximum response times are usually better for InnoDB the average and p99 response times are much better for MyRocks.